Top Chocolate Bars in UK - Data Visualization with Tableau(MoM 3/29)
Data visulizaiton would always be fun if you have some interesting data. I learned and gained the inspiration from my friend Yu Dong. Every week, This website would share a new social data and the article related to it, and would ask people to replicate the project in data visualization tools. I found it pretty interesting so I decided to give it a try this weekend! Hope I can make it into a tradation for each week. :)
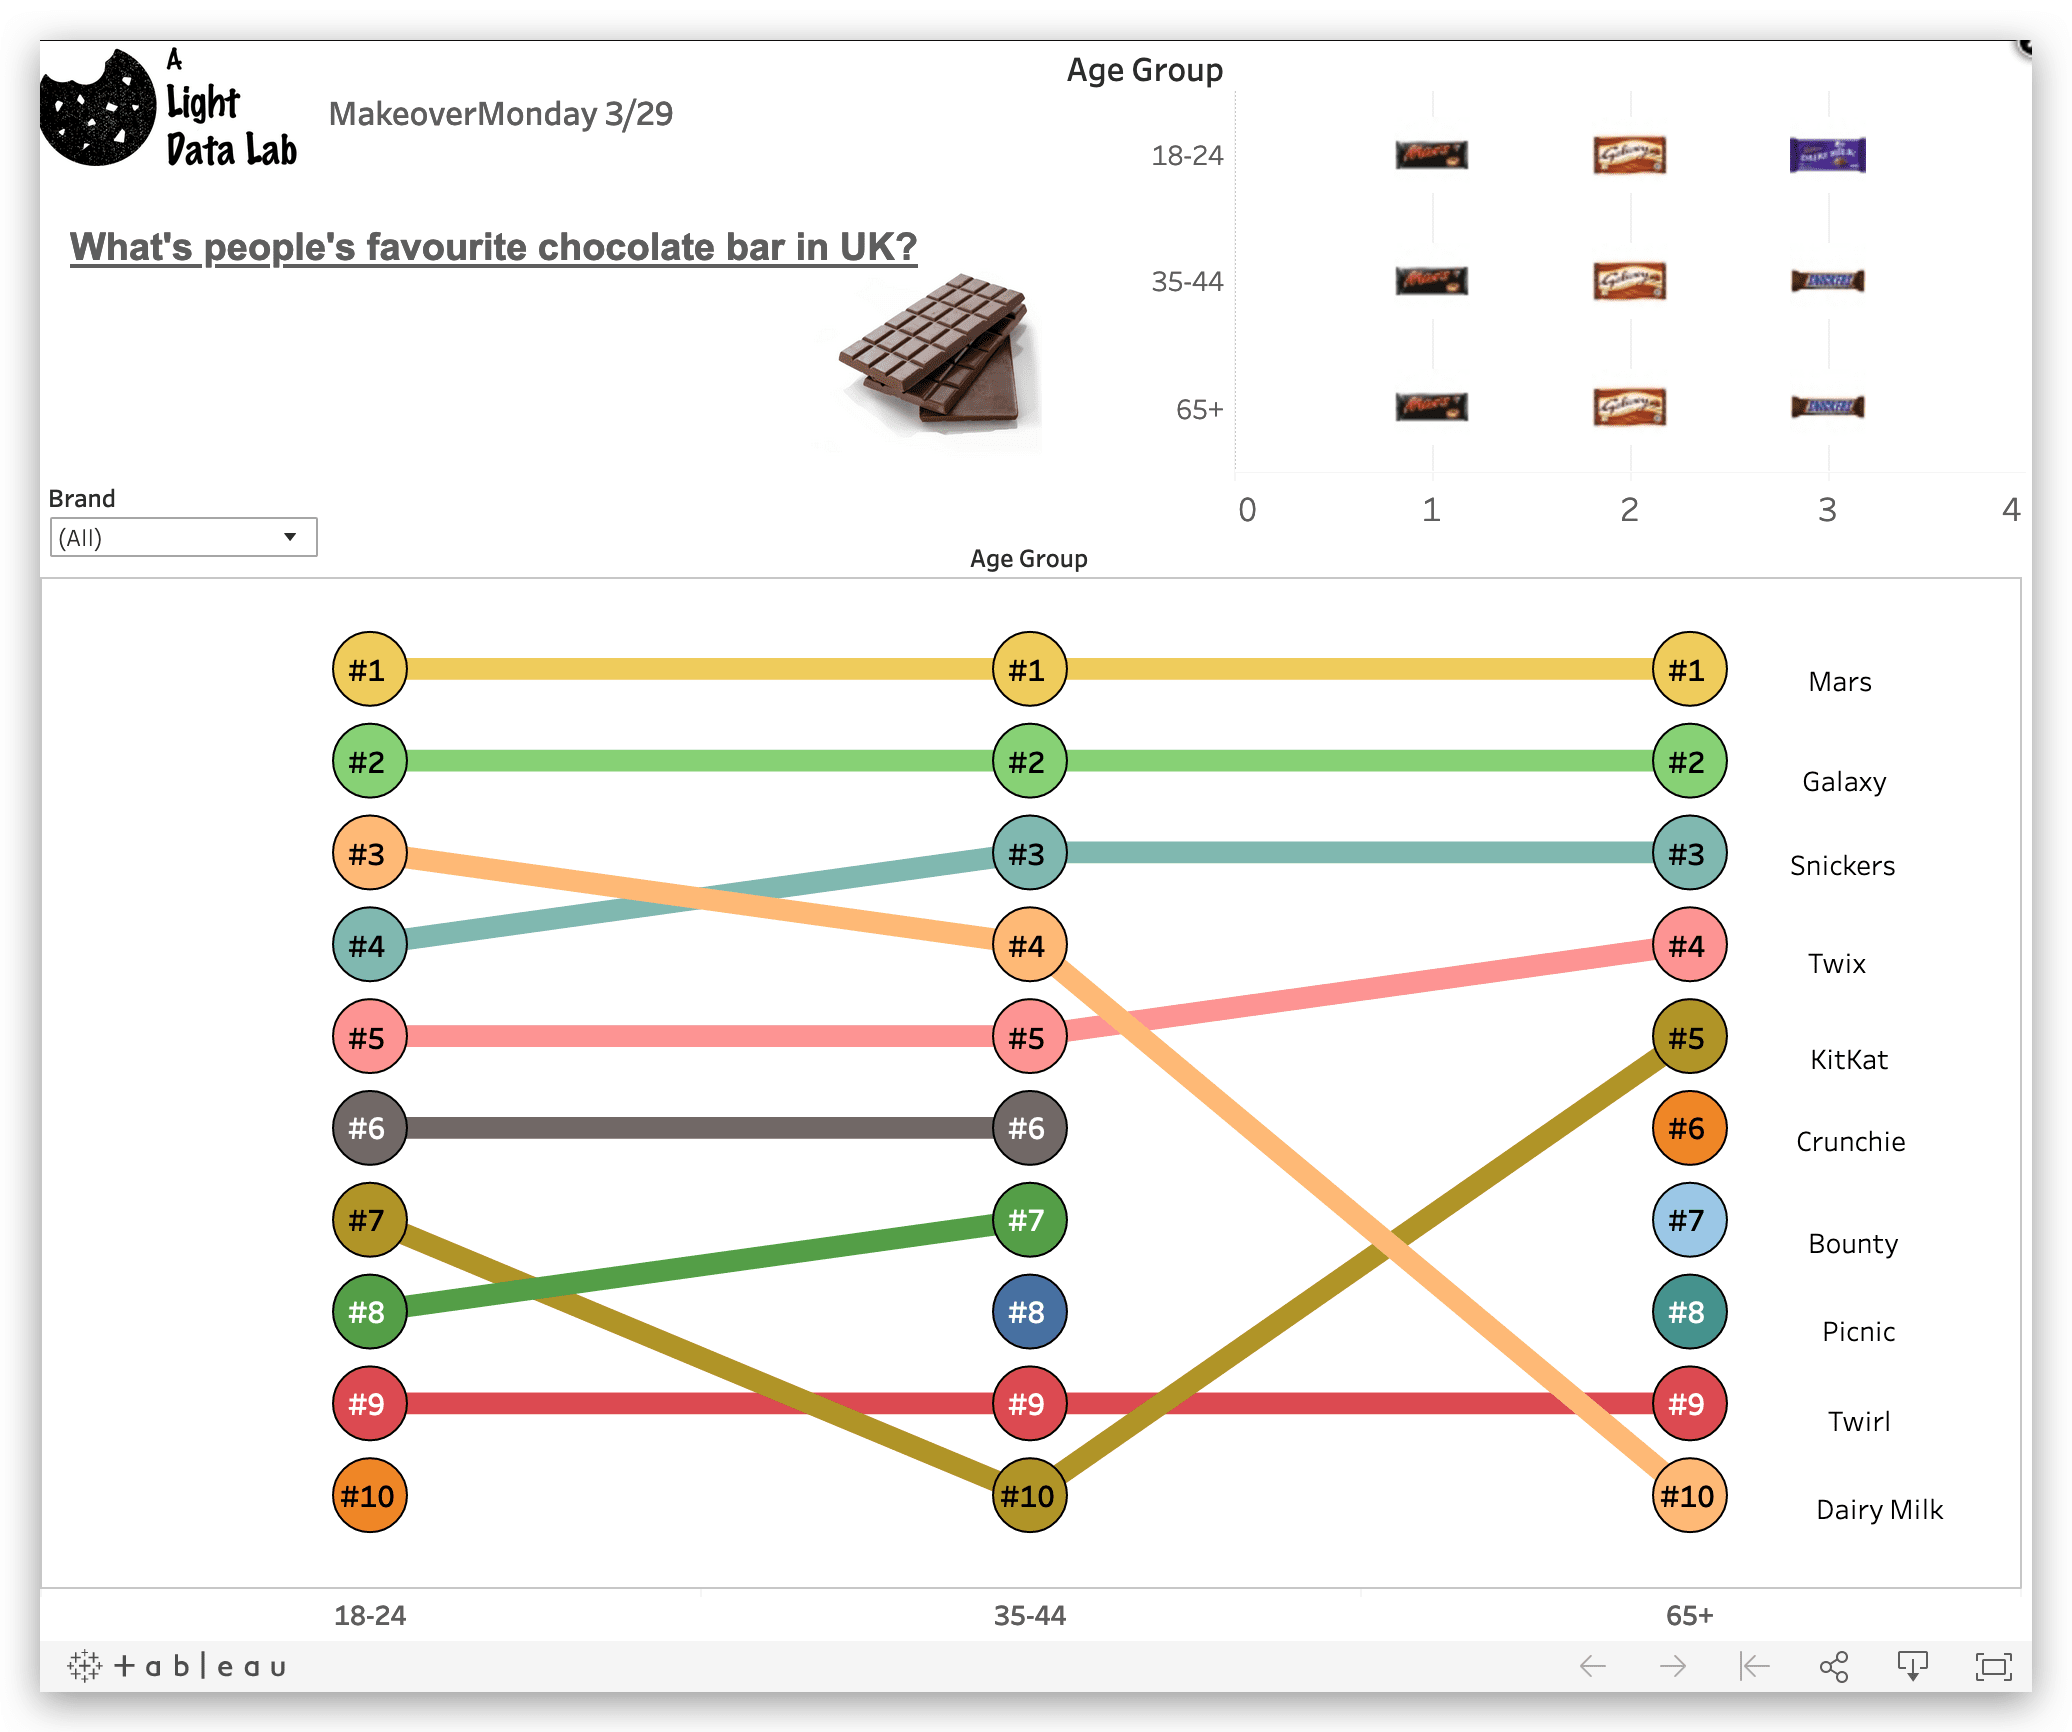
I also took reference from the bump chart and custom shapes.
The Tableau Dashboard is here